I tell my fellow researchers that I use this Substack newsletter as a family history tool, but what does that mean?
Spotting the Gaps
The main function of the newsletter is to share stories about my research. I don’t use Substack to search records or manage the tree, but crafting the stories is part of my process. Doing that makes up for some other things I should be doing— like maintaining a research log—that I don’t do.
The stories can be roughly categorized as “what I found” and “how I found it.” The “how I found it” stories tend to be about processes, record analysis, tips, etc. The “what I found” stories sometimes exist as fleshed-out stories with characters, a beginning-middle-end structure, and a thematic idea. Sometimes they give a few facts and pose questions about the gaps.
Those gaps are crucial.
When I look at the pattern of previous posts here, I pay attention to what is missing. Which branches of which families have I been ignoring? What obstacles have I been avoiding? Where am I weak?
Answering these questions helps me break down the larger problems that confront anyone attempting to document their family history. Problems of scope and scale, and questions like, “Where do I draw the line?” We’ve established the importance of following up on “shirttails” - but that fuzzy, porous border between “relative” and “not really relative” is going to be different for everyone.
Diving Down Deep
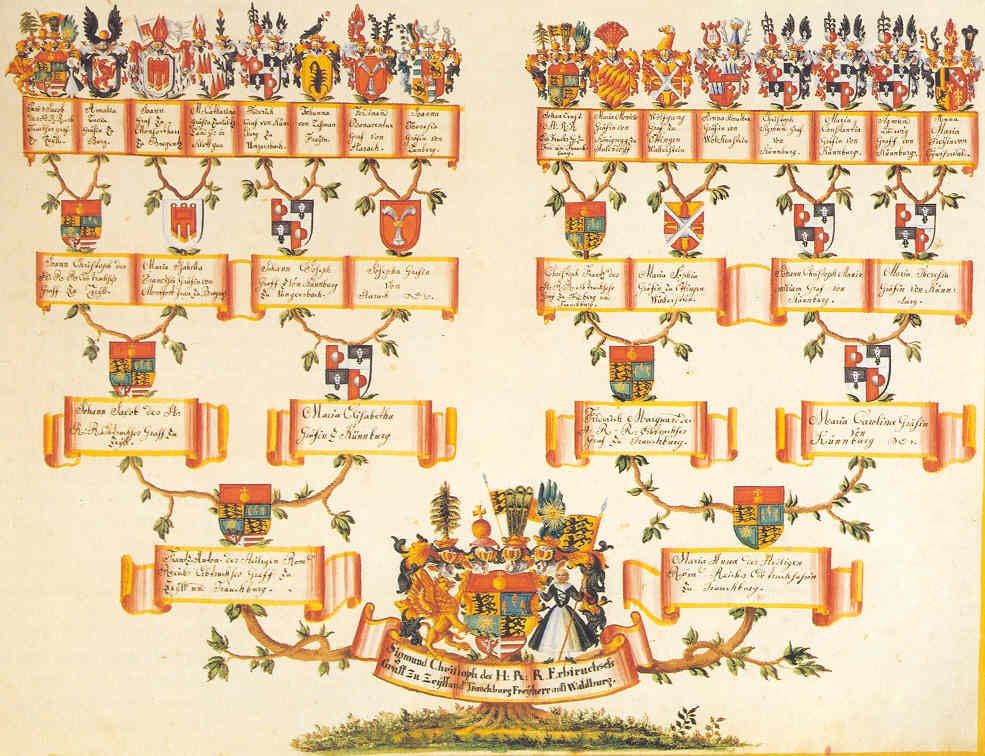
When you start out in genealogy, there are lots of neat, tidy charts to help you visualize what your ancestry “looks” like.

But most of the tidy charts force us to ignore siblings and cousins, adoptions, childless marriages, unmarried relatives, etc. because if we don’t ignore them, our “tree” might start to look more like this:

That is a visualization of the Mandelbrot set, which is a mathematical concept defining the perimeter of an object in a way that becomes infinite as you look more closely at the edge. I’m oversimplifying, but the point should be clear: we can’t deal with the infinite, so we make choices.
I spent a lot of time (about 7 years) running down as many of the descendants of my most distant Callin ancestor as I could. When I began, I was working with a 1911 family tree that included about 100 people; by the time I was done, my estimated count of direct descendants from James Callin topped the 2,500 mark. With spouses and their parents’ names, my index ballooned to the point where it didn’t fit into the final publication.
We’ve established that we all have Sixteen great-great grandparents and that the number of greats doubles with each generation. James Callin, my 5th-great grandfather, is one of 128 5th-greats. If running down his descendants over 8 generations clocked in at 2,500 people, and there is no sign of pedigree collapse between them, I have to assume that collecting just the direct descendants of my 128 5th-greats would run to 320,000 individuals.
And then there are siblings….
On the Bright Side…
With numbers like those, it’s unlikely a newsletter like mine will ever run out of content.
The real challenge lies in finding the time to thoroughly document everyone and put their profiles into WikiTree. I’ve done alright, according to the “Ancestor Lines Explorer” app on the site:
“Out of 62 possible direct ancestors in 6 generations, 62 (100.00%) have WikiTree profiles and out of them, 0 (0.00%) occur more than once due to pedigree collapse.”
“Out of 126 possible direct ancestors in 7 generations, 104 (82.54%) have WikiTree profiles.”
If I plug in one of my kids as the base person, instead of me:
“Out of 254 possible direct ancestors in 8 generations, 160 (62.99%) have WikiTree profiles.”
What is less easy to capture is the amount of work I’ve done beyond the simple direct ancestors. For each generation, I’ve determined to add profiles for all of the siblings of each ancestor - a number that can vary wildly, of course. For my grandma Alberta, that means one additional profile for her sister, Lyle (Tuttle) Kuebler. But my grandpa Russ, Alberta’s first husband, was one of 12 children… and his father, David Ulysses Clark, was one of 10.
Depending on the availability of records, I spend between 2 and 8 hours on each WikiTree profile, so even if we assume a low average of 3 hours per profile, Grandpas Russ and David Clark cost me 66 hours of work, give or take.
And if that feels overwhelming, just remember: this is what I do to relax.
So What?
So, we’re back to looking at the balance and mix of Mightier Acorns posts. I do my best to spend equal amounts of time on the various branches of the family, but the stories are going to favor the branches I’ve worked on most recently—like Valentine Shuffler’s group—or who have more identifiable people with stories I can tease out of the records.
And at this rate, if I ever run out of “gaps” I will be very, very surprised.


I have a smilar approach as to who I write about. Some lines are much better documented.
Do you record on wikitree that you have written a post? I have done so sometimes using See also under the Sources heading.
Just came back to your post again 😉 Wondered if you had come across Sun charts? MyHeritage has a very nice tool for charting descendants. I reviewed it some years ago at https://anneyoungau.wordpress.com/2016/06/17/sun-charts/
Here is an example https://anneyoungau.wordpress.com/wp-content/uploads/2016/06/25c36-dec2ball2bgens2bscreenshot.jpg which shows 12 generations in 1 chart.
I printed it off successfully at the local stationary store in a single very large sheet.